
Using Data to Improve Outcomes for BIPOC Children
May 2022
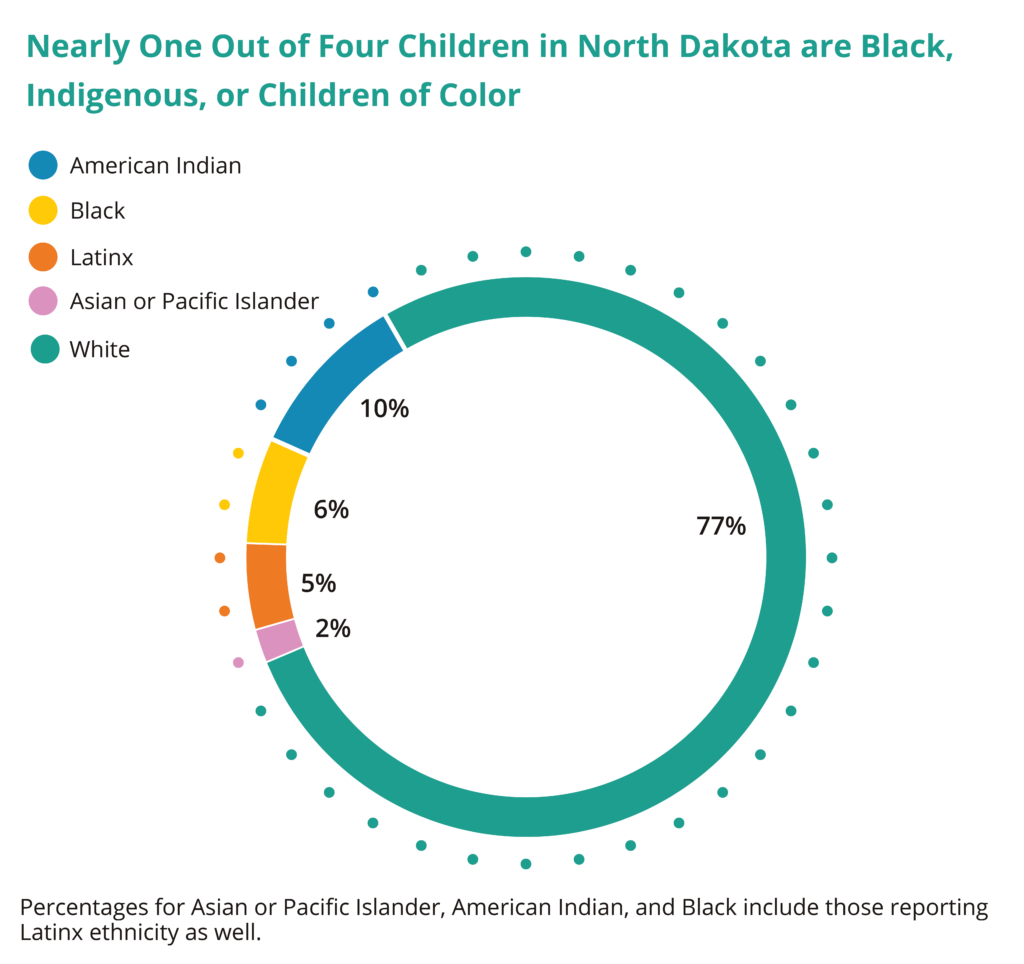
North Dakota is growing and becoming increasingly diverse. In the last decade, nearly 91,000 new people called North Dakota home.1 Black, Indigenous, and other people of color (BIPOC) made up more than half of that increase. Nearly one out of every seven North Dakotans is a person of color. North Dakota children are even more diverse, as nearly one out of four children are BIPOC.
As a result of generations of discrimination and racism, families and children of color in North Dakota face more barriers to economic opportunities, face more limited access to high-quality education, and must navigate an underfunded health care system that makes it harder to be healthy. This report highlights stark disparities between health, education, and economic outcomes for children of color and white children.
Reporting data by race is necessary to acknowledge where systems are failing children of color, making it harder for them to reach their full potential. It is equally necessary to acknowledge that focusing on disparities results in a skewed narrative, one that overlooks the strengths of BIPOC communities. Black, Indigenous, and people of color in North Dakota are vital members of our community and attend North Dakota colleges or work as doctors, teachers, business owners, and in many other professions. BIPOC own 6 percent of the small businesses in North Dakota.2 While overall college enrollments have declined in the last decade (down 11 percent since 2011), enrollment of BIPOC in North Dakota colleges increased during the same time frame by at least 21 percent.3
The stark disparities highlighted in the data are a direct result of policies and programs that have systemically discriminated against Black, Indigenous, and other people of color across many generations. For example, the federal government has failed to honor its treaty and trust responsibilities to provide health care, education, housing, economic development, and agricultural assistance in tribal communities.4 The special trust relationship between the federal government and tribal nations obligates federal support for the general well-being of tribal communities in exchange for tribal land. The federal government’s failure to uphold this trust relationship translates to underfunded community programs over many decades.4

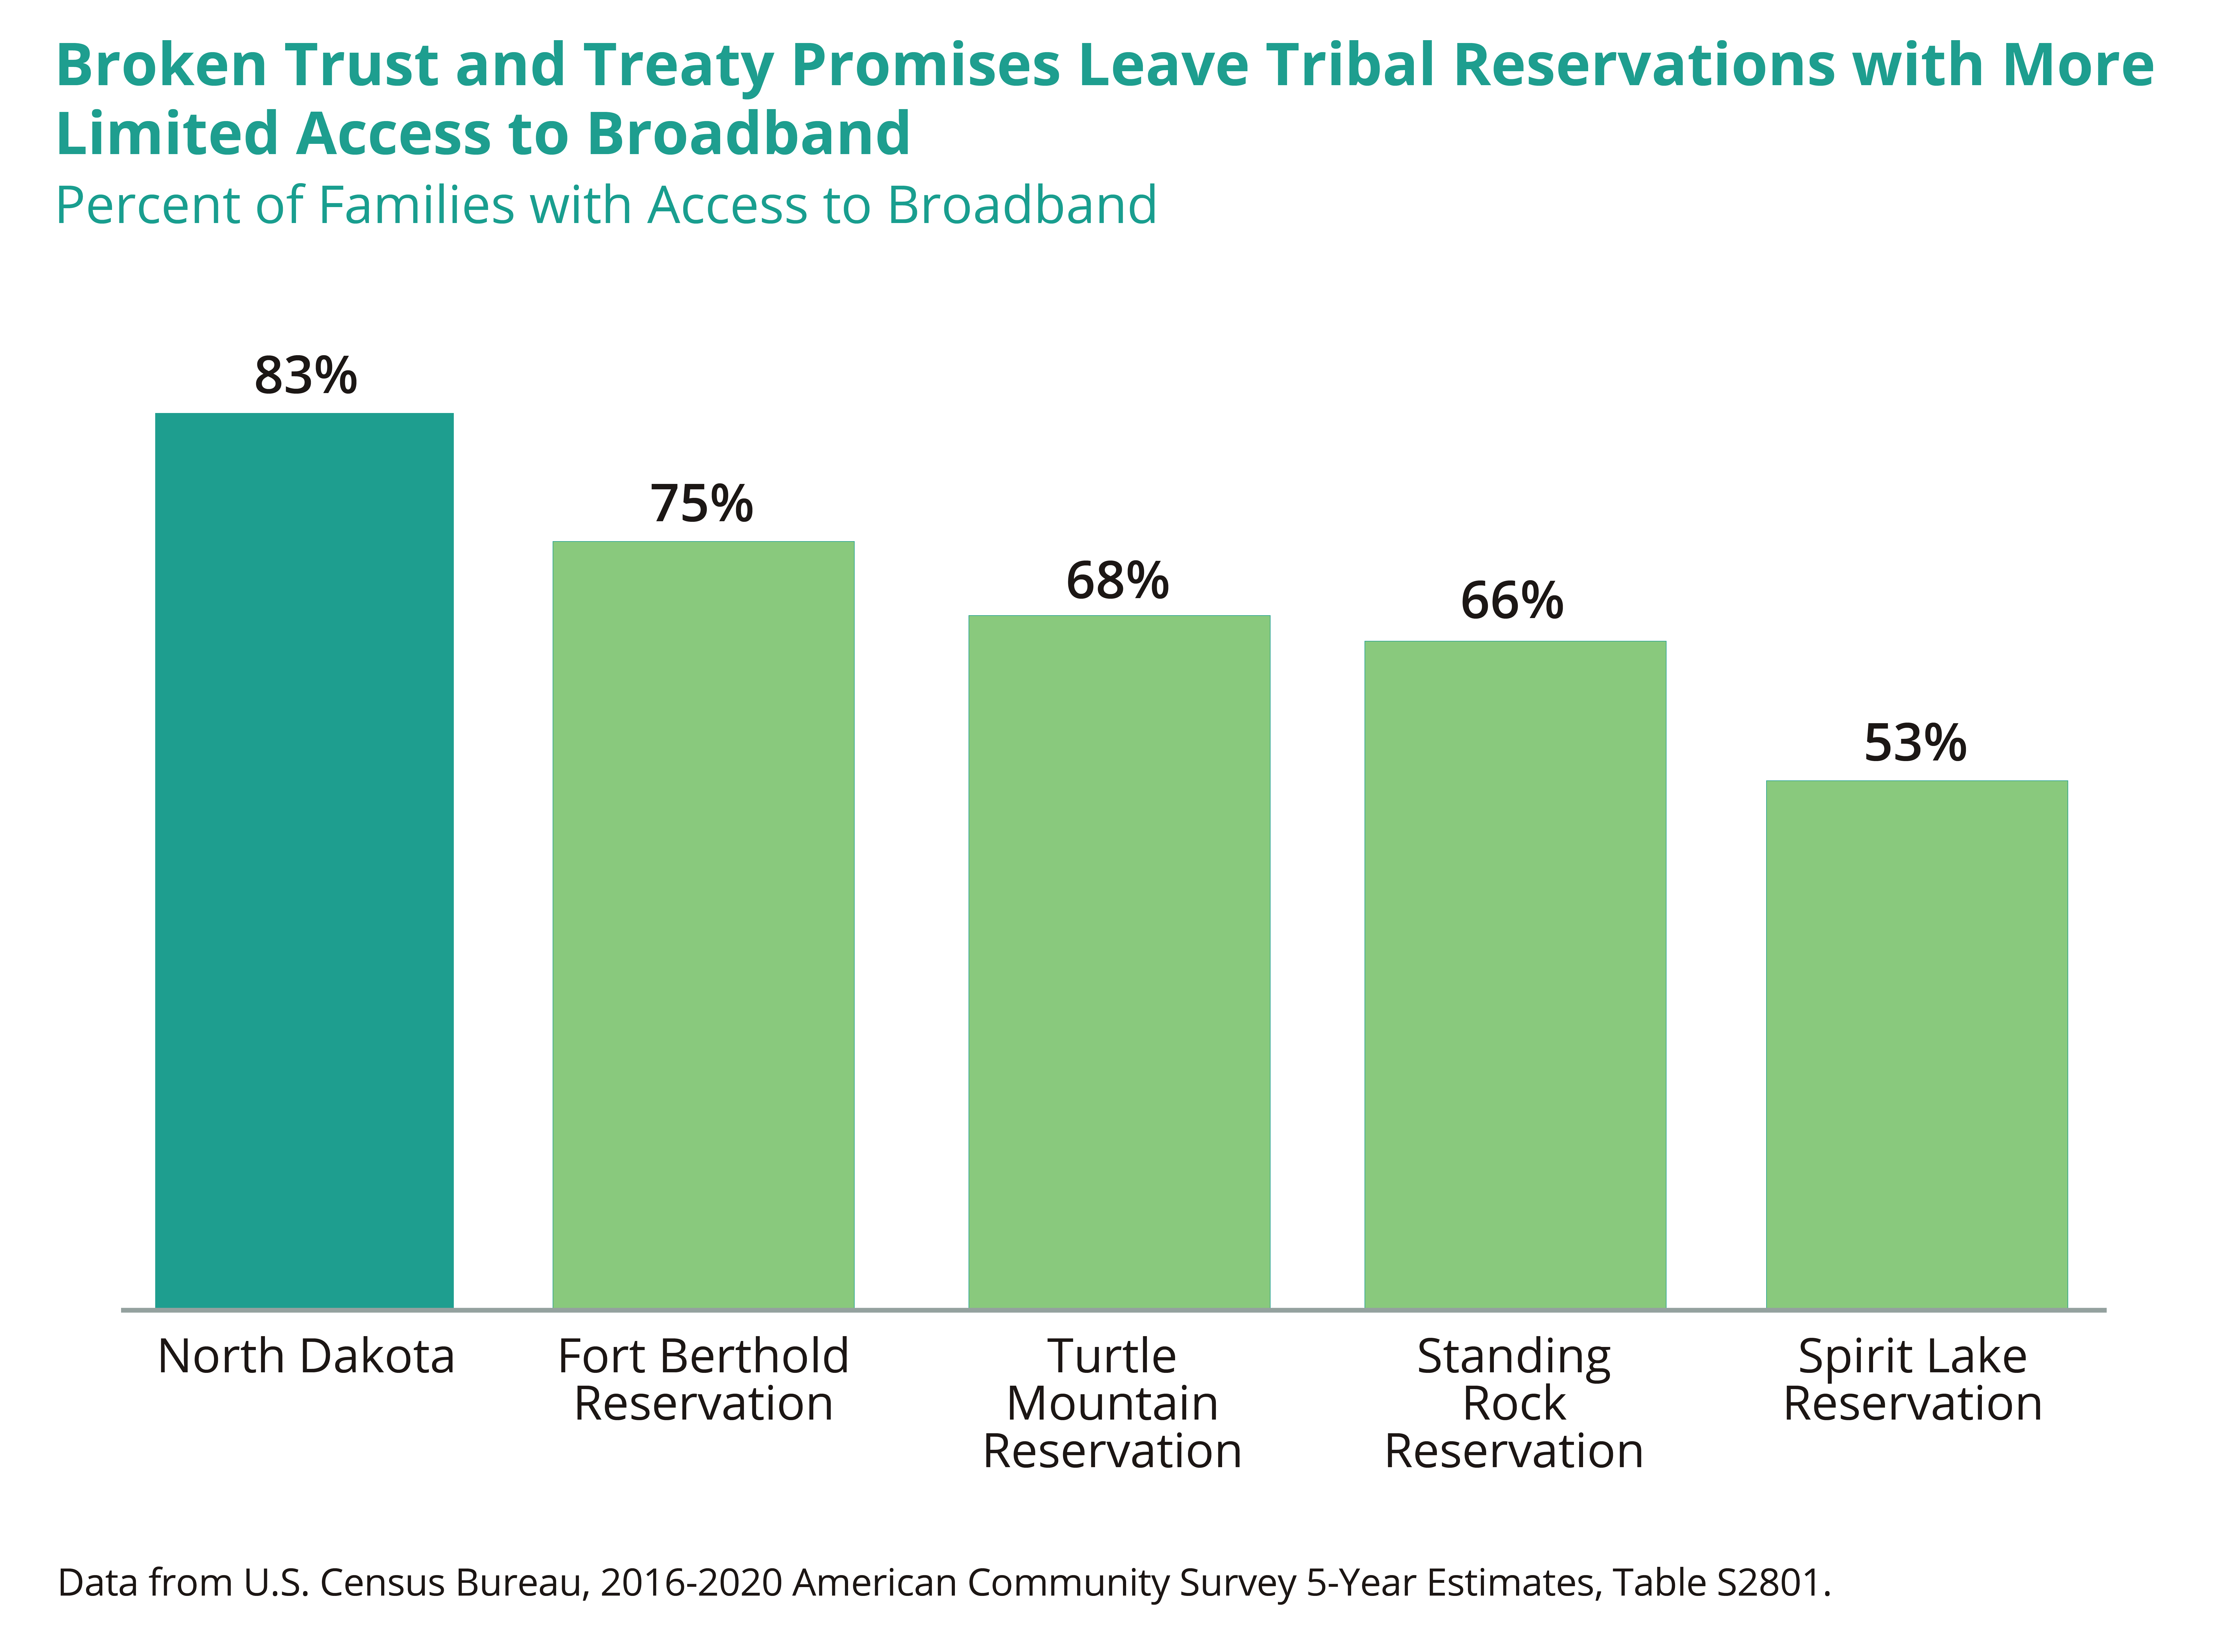
The federal government has also failed to honor treaties with tribal nations through forced relocation and loss of land. For example, two tribal nations within North Dakota lived and relied on land along the Missouri River. The fertile land provided resources for agriculture and economic security. When the federal government built dams along the Missouri River in the mid-20th century, tribal nations were forced to give up land that was rightfully theirs and relocate to land without the same access to natural resources.5 The loss of this land was significant for tribal communities and made it harder to remain self-reliant and build economic prosperity. The stolen land paired with a lack of investment in the areas tribal nations were relocated to result in present-day disparities in access to utilities like electricity or broadband.4 Monthly electricity bills are 9 percent higher in counties that overlap with a tribal reservation in North Dakota compared to non-reservation counties.6 Tribal reservations located within North Dakota also have more limited access to broadband than the rest of the state.7
The disparities highlighted in this report extend beyond broken treaties and underfunded federal programs. Discriminatory and racist policies, present throughout North Dakota’s history, have made it harder for families of color to access the same opportunities as white families. A long history of housing discrimination in the U.S. is one reason why home ownership rates are lower for families of color. One example of this is the practice of redlining in the 1930s. Through this practice, the federal government designated certain neighborhoods lower quality based only on racial and ethnic prejudice. These neighborhood quality ratings were then used to determine whether a family qualified for a federal mortgage loan. Redlining was one discriminatory practice that systematically denied families of color access to purchasing homes.8 While neighborhood quality maps were not drawn in North Dakota, discrimination in access to housing loans persists throughout the state.8 Even after controlling for income level, families of color are denied mortgage loans at a higher rate in North Dakota. Between 2004 and 2014, mortgage loan denial rates for American Indian and Latinx families were more than double the rate for white families within the same income bracket (24 percent for American Indian, 23 percent for Latinx, and 9 percent for white).9 Home ownership matters when considering economic security and wealth accumulation across generations. Equity in a home is the largest financial asset for middle-income families.10 When families of color are denied the same opportunities to purchase homes, they are also denied the opportunity to build wealth across their lifetime that can be passed on to their children. Housing discrimination is just one example of many for how past policies shape the reality for children and families of color today.
The legacy of discriminatory policies and broken treaties makes it imperative to consider data disaggregated by race so we can build a system that works better for children of color. As babies grow and learn throughout childhood and transition from adolescence to young adults, there are ways to ensure all North Dakota children have what they need to thrive.
BIPOC Children Face More Barriers to Growing Up Healthy
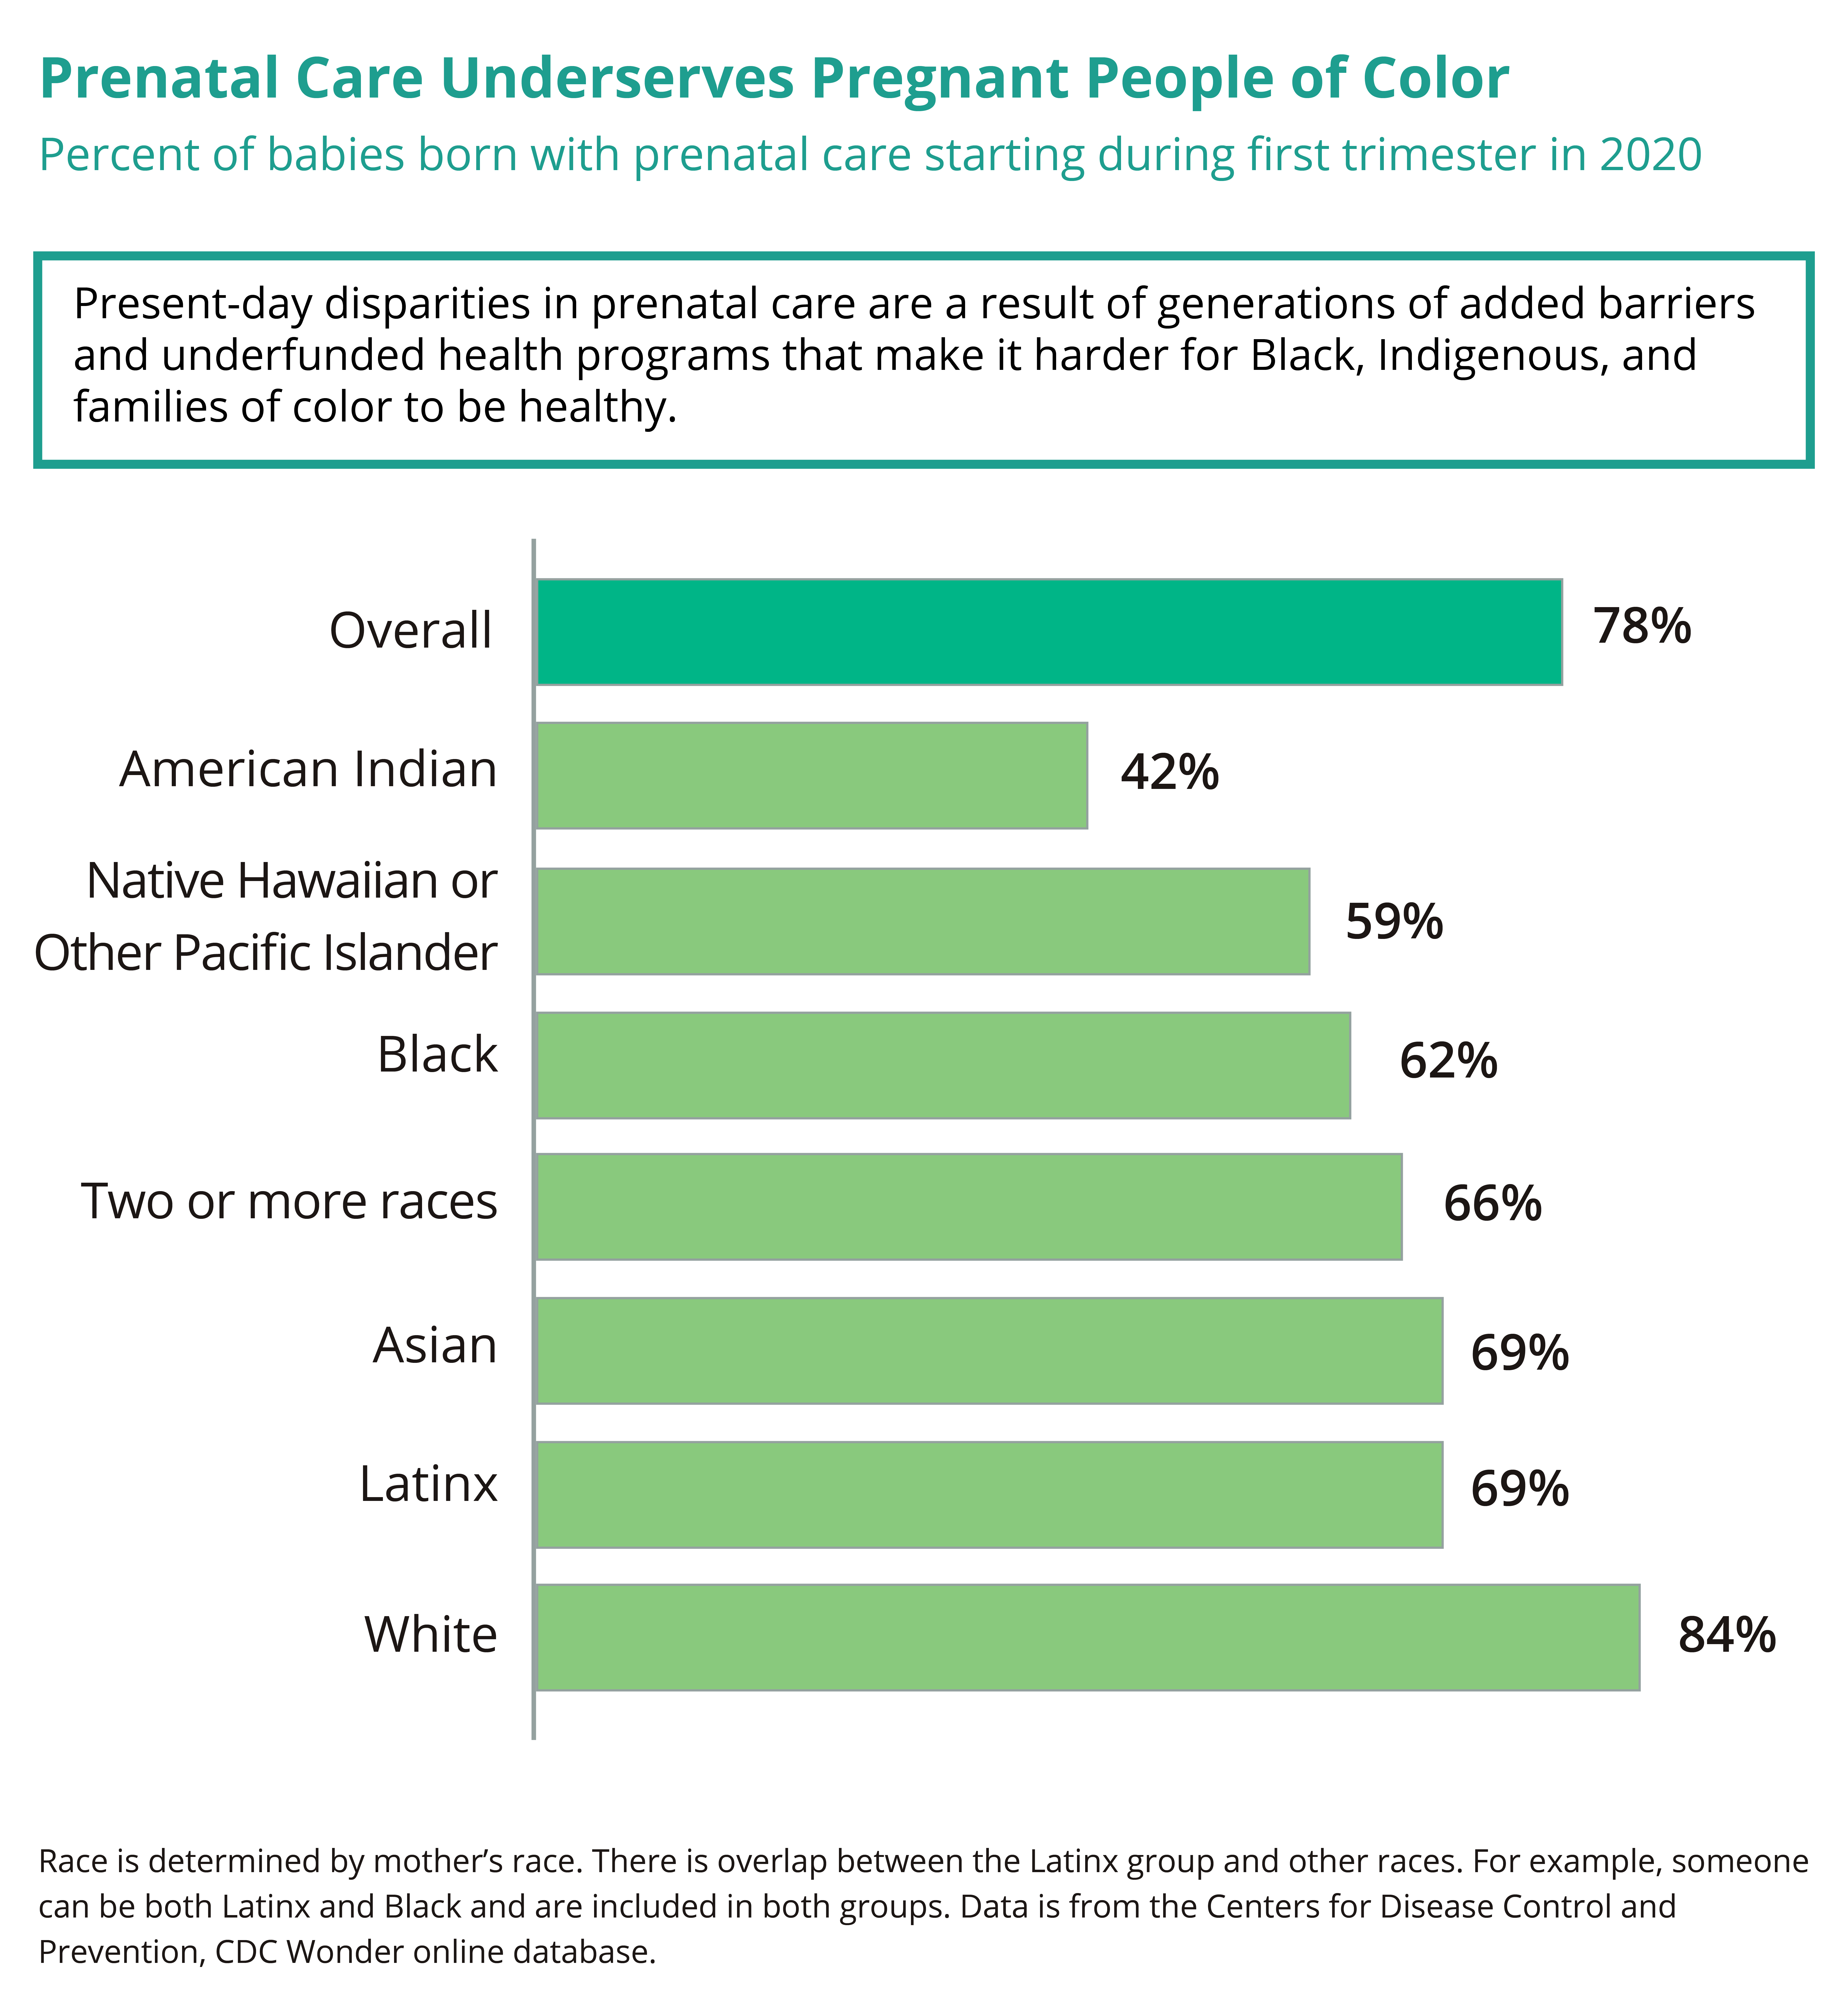
Accessing prenatal care early in a pregnancy is one measure of how the health care system supports expecting parents. Early prenatal care has been shown to support better infant and maternal health outcomes.11 While many families of color do start prenatal care during the first trimester, systemic barriers make it harder for more BIPOC families to access prenatal care early in their pregnancy.12
Disproportionate rates for prenatal care signals additional barriers families of color face when accessing health care. Young children need preventative health care visits as they grow and develop. All families and children should have health insurance to improve access to needed medical care. However, the barriers families of color face in our health care system go beyond simply having coverage. People of color have more limited access to providers and hospitals, have more difficulty finding culturally appropriate care, and experience lower quality of care.11 Many American Indian families rely on services provided by the Indian Health Service (IHS). The federal government is obligated to provide health care to American Indians as part of its trust responsibilities established through treaties with tribal nations. The federal government has chronically underfunded the IHS, receiving only 57 percent the per person funding as Medicaid (per person expenditures are $4,078 for IHS and $7,106 for Medicaid), leaving many American Indian families without access to full medical care when they need it.13, 14 Chronic underfunding of the IHS also means there is not enough funding to address all maintenance and facility costs, such as maintaining or purchasing medical equipment. This has left a backlog of projects that cost $954 million and further limits IHS from offering comprehensive medical care for American Indian families.15
Recommendations:
- Ensure that all children who are eligible for Medicaid are enrolled. About 83 percent of eligible children participated in Medicaid in North Dakota.16 This was the second lowest Medicaid participation rate in the nation and means 1 out of 5 eligible children are not enrolled.
- Fund the Indian Health Service (IHS) at the same per person rate as Medicaid and provide funding to address the more than $900 million in facility and maintenance backlog.
BIPOC Families Face More Challenges in Achieving Economic Security
Living above the poverty level is often used as a marker of economic security for families. Families living on limited income must make tough choices on how to pay for housing, food, utilities, and other costs just to meet their basic expenses. While all families should have the resources they need, the reality is that Black, Indigenous, and other children of color in North Dakota are more likely to live below poverty level.17
While having enough income to meet basic expenses is critically important, true economic security for families is more than income. Economic security for families is often accumulated over generations by building wealth. This could mean owning a home, investing in higher education without debilitating debt, or having savings to make it through hardships. However, not all families have had equal access to opportunities that build this type of economic security. Because of a history of discriminatory housing policies, Black, Indigenous, and other families of color are less likely to own their own homes in North Dakota.18 Lower homeownership rates today reinforce the racial wealth gap that past housing policies helped create, just in the same way that one’s inability to own a home limits their ability to build wealth. This interaction helps perpetuate the racial wealth gap. The median net worth for white families was $189,100 in 2019, where Black families had $24,100 and Latinx families $36,050.19
Economic security requires more than home ownership. Present-day disparities in economic security among American Indian families is a direct product of broken treaties, taking land for projects like dams, and forced relocation to areas with fewer natural resources. Over generations, the failure of the federal government to invest in tribal communities results in present-day disparities in infrastructure for things like electricity and internet. To advance economic security in tribal communities, the federal government must work against the consequences of its past policy choices and make better investments in energy needs in Indian Country.
Recommendations:
- Invest in tribally led projects that strengthen rural climate and energy democracy. Federal and state investments in energy democracy for Indian Country can help make utilities more affordable and reliable and provide high-speed internet to more tribal communities.
- Raise the minimum wage in North Dakota. A single parent with one child who works 40 hours a week at minimum wage ($7.25 per hour) makes $15,080 a year, or less than poverty-level wages.
More Supports Needed for All Students to Succeed in School
A high school education is important to success later in life. Research consistently shows that youth who graduate from high school earn more money over their lifetime.20 High school graduates also are less likely to engage in behaviors like smoking and have a stronger support network.21
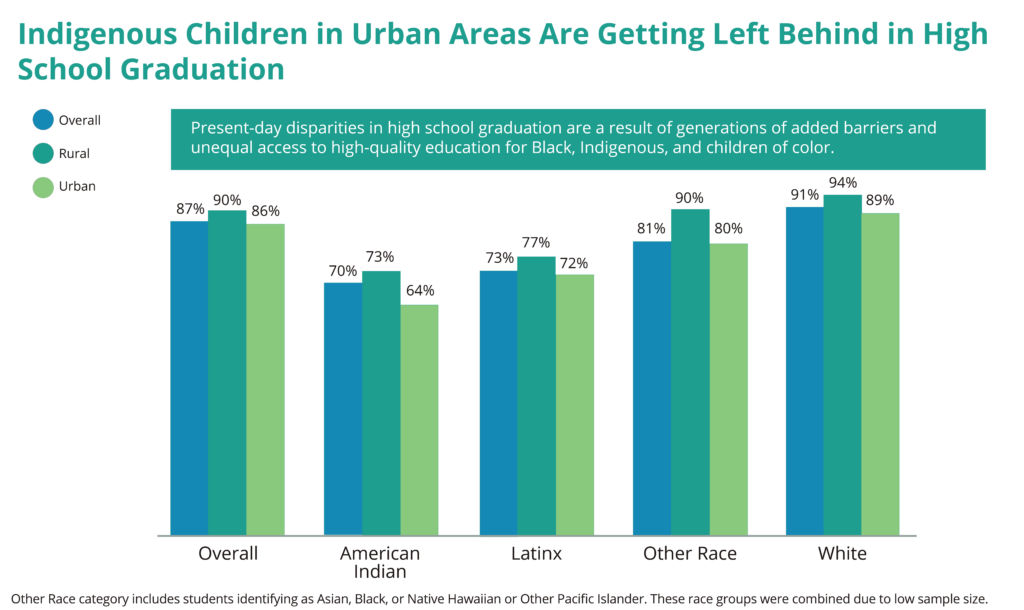
In North Dakota, Black, Indigenous, and other youth of color experience lower graduation rates compared to their white peers.22 American Indian students in urban school settings experience even more barriers to graduation, where 64 percent of American Indian students in urban districts graduate high school compared to 86 percent of all students in urban districts.22 Many factors impact student success and ultimately influence whether a student graduates from high school. For example, Indigenous students are less likely to attend preschool and have less experienced teachers throughout their time in school.4 BIPOC students in North Dakota are also more likely to be disciplined and are referred to law enforcement at double the rate of their white peers.23 These factors make it harder for BIPOC students to stay on track and succeed academically.
One strategy for improving academic success for American Indian students is to incorporate more culturally based education into the curriculum.4 Native American history is a required part of the fourth and eighth grade curriculum in North Dakota, since legislators passed Senate Bill 2304 in 2021.24 School curriculum that includes American Indian culture, heritage, and history can help Indigenous students feel a sense of belonging and improve their academic success.25 Ensuring public schools and educators have the training and resources to fully implement the new Native American curriculum is one way to foster a more culturally relevant education for the 89 percent of Indigenous students that attend public schools in North Dakota.26
Recommendations:
- Ensure more equitable and accountable funding that supports students of color in public schools. Ensure input from tribal communities and families of color as decisions are made for supporting Black, Indigenous, and youth of color.
- Ensure schools and educators have the resources needed to fully implement the Native American curriculum requirements. A more inclusive curriculum that includes Native American history can help Indigenous students feel a sense of belonging and improve academic success.
Disparities Persist into Young Adulthood
Not all youth have access to resources and opportunities as they transition from adolescence to adulthood. One out of every four North Dakota young adults (age 18 to 24) live in poverty, a rate more than double any other age group in the state.27 Additional education is one tool for young adults to gain skills and training after high school. In the last decade, college enrollment increased by 4 percent for Asian students, 10 percent for Black students, 73 percent for Latinx students, and 175 percent for those identifying as more than one race.3 Likely due to disparities in graduation rates and the disproportionately high cost of college relative to median income, college enrollment for American Indian students declined at the highest rate (28 percent) of any group in the last decade, signaling a need for more support for Indigenous student success.3
Five tribal colleges operate within North Dakota and enroll nearly 14,000 students.3 Black, Indigenous, and other students of color make up 95 percent of the student population at tribal colleges within North Dakota. Tribal colleges provide an important pathway to higher education for American Indian students that is more accessible, affordable, and culturally relevant. College enrollment is just one pathway to gain additional skills and knowledge on the path to a career but may be out of reach for people who cannot afford the cost of tuition or must balance the demands of work and home. Programs like apprenticeships and work-study programs that combine education and employment opportunities are an important pathway for youth to gain the skills they need for a career.
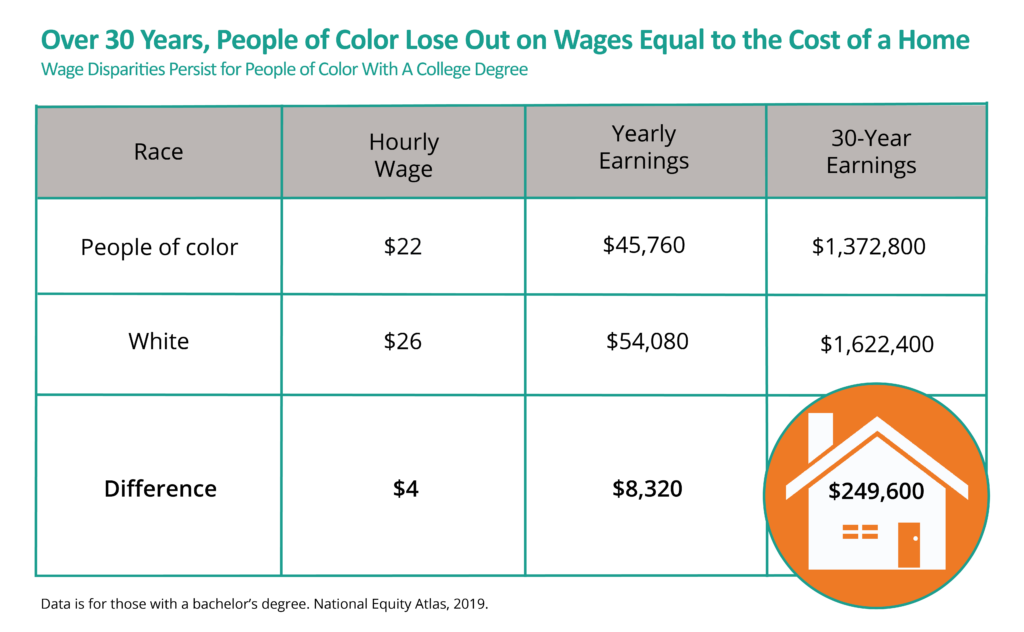
While higher education is an important tool for many young adults to secure a well-paying job, education alone does not account for the wage gap. People of color with a bachelor’s degree or higher earn four dollars less in median hourly wage compared to their white peers with the same education.28 This difference means losing out on $8,320 per year and nearly a quarter of a million dollars less over a 30-year career.
Recommendations:
- Work with employers to invest in apprenticeships and work-study programs. Programs that combine education and employment opportunities are an alternative for young people who cannot afford college or must balance the demands of work and home.
- Cover tuition at all North Dakota higher education institutions for tribal members. More accessible higher education is a path for American Indian students to pursue a degree.
Conclusion
All children deserve to be healthy, pursue education, and have the economic resources they need to thrive. Yet Black, Indigenous, and other children of color in North Dakota continue to face barriers along the way to reaching their full potential. Implementing solutions that address inequities is good for North Dakota and necessary to close the gap in health, education, and economic outcomes for BIPOC children.
Footnotes
- Missouri Census Data Center, Population Estimates by Age, “North Dakota 2010-2020,” accessed on Apr. 14, 2022.
- U.S. Small Business Administration, Office of Advocacy, “2021 Small Business Profile North Dakota,” accessed on Apr. 14, 2022.
- Institute of Education Sciences, National Center for Education Statistics, “Enrollment trends by race/ethnicity and gender,” accessed on Apr. 14, 2022.
- U.S. Commission on Civil Rights, “Broken Promises: Continuing Federal Funding shortfall for Native Americans,” Dec. 2018.
- State Historical Society of North Dakota, “Lesson 1: Changing Landscapes, Topic 1: Garrison Dam and Diversion, Section 3: The Taking,” accessed Apr. 18, 2022.
- National Renewable Energy Laboratory, “Solar for All,” accessed on Apr. 15, 2022. Data downloaded from map includes the average household monthly electricity expenditures for low-to-moderate income families. Counties included in the reservation analysis are: McKenzie, McLean, Mountrail, Sioux, Dunn, Benson, and Rolette. Average monthly electricity cost for counties in the reservation analysis was $138 compared to $127 in non-reservation counties.
- U.S. Census Bureau, “Types of Computers and Internet Subscriptions, 2016-2020 American Community Survey 5-Year Estimates, Table S2801,” accessed on Apr. 18,2022.
- Root Policy Research, “City of Grand Forks Analysis of Impediments,” May 18, 2020.
- Comparisons are made for those earning more than $75,000 across the three race groups. Western Economic Services, LLC, “2015 State of North Dakota Analysis of Impediments to Fair Housing Choice,” Mar. 26, 2015.
- Schuetz, J., “Rethinking homeownership incentives to improve household financial security and shrink the racial wealth gap,” Brookings, Dec. 9, 2020.
- Artiga, S., Pham, O., Orgera, K., Ranji U., “Racial Disparities in Maternal and Infant Health: An Overview,” Kaiser Family Foundation, Nov. 10, 2020.
- Center for Disease Control and Prevention, CDC Wonder Online Database, “Natality Information for 2016-2020.”
- U.S. Department of Health and Human Services, Indian Health Service, “IHS Profile,” accessed on Apr. 14, 2022.
- Kaiser Family Foundation, “Medicaid Spending Per Full-Benefit Enrollee,” accessed on May 16, 2022.
- Grinnell, R., “Testimony from Randy Grinnell, MPH on Examining Federal Facilities in Indian Country before House Committee on Natural Resources,” Jun. 17, 2021.
- Kaiser Family Foundation, “Medicaid/CHIP Child Participation Rates, 2013-2016,” accessed on Apr. 14, 2022.
- U.S. Census Bureau, “Poverty Status in the Past 12 Months by Sex by Age (White Alone, Black Alone, American Indian, and Alaska Native Alone, Asian Alone, Native Hawaiian and Other Pacific Islander Alone, Some Other Race Alone, Two or More Races, Hispanic or Latino), 2016-2020, Tables B17001A,B,C,D,E,F,G, and I,” accessed on Apr. 18, 2022.
- U.S. Census Bureau, “Demographic Characteristics for Occupied Housing Units, 2016-2020 American Community Survey 5-Year Estimates, Table S2502,” access on Apr. 18, 2022. Home ownership rates by race: 8 percent for Black, 48 percent for American Indian, 31 percent for Latinx, 27 percent for Asian, 37 percent for Other, compared to 67 percent for non-Latinx white families.
- The Federal Reserve, “Survey of Consumer Finances, 1989-2019, Net worth by race or ethnicity,” access on Apr. 18, 2022.
- Office of Disease Prevention and Health Promotion, “Healthy People 2020: High School Graduation,” accessed on Apr. 18, 2022.
- Freudenberg, N., Ruglis, J., “Reframing school dropout as a public health issue,” Prevention Chronic Disease, Jan. 2008.
- North Dakota Department of Public Instruction, analysis of four-year cohort graduation rates by race and ethnicity, data was a special request and on file with author. Rural and Non-rural status was determined using the National Center for Education Statistics Definitions. Rural school districts are those that include majority of schools in the Rural Category. Non-rural districts have majority of schools classified as City, Suburb, or Town. Institute of Education Sciences, National Center for Education Statistics, “Definitions: School Locale Definitions,” accessed on Apr. 19, 2022
- Whitaker, A. et al., “Cops and No Counselors: How the Lack of School Mental Health Staff is Harming Students,” American Civil Liberties Union, Mar. 2019.
- North Dakota 67th Legislature, “Relating to requiring all elementary and secondary public and nonpublic schools in the state to include curriculum on Native American history; and to provide an effective date,” SB 2304, enacted on Apr. 23, 2021.
- EdNote, “The Importance of Providing Native American Education for All Students,” Dec. 16, 2019.
- Shockley, E., Department of Public Instruction, “RE: Question on race data,” email to Xanna Burg, North Dakota KIDS COUNT, Apr. 4, 2022, on file with author.
- U.S. Census Bureau, “Poverty Status in the Past 12 Months by Sex by Age, 2016-2020 American Community Survey 5-Year Estimates, Table B17001,” accessed on Apr. 14, 2022.
- National Equity Atlas, “Wages: Median: In an equitable economy, all workers would earn a living wage, without systemic difference by race and gender,” accessed on Apr. 14, 2022.